Bogota Public Transport UX Improvement
User experience design project for improving journey planning and real-time information access in Bogota's Integrated Public Transport System (SITP)
Bogota Public Transport UX Improvement
Overview
User experience design project for improving journey planning and real-time information access in Bogota's Integrated Public Transport System (SITP)
Project Overview
Taller Bogotá is a comprehensive UX/UI design project that addresses the fundamental challenge: “How to guarantee timely information to users about trip planning to improve their experience in Bogota’s transport system?”
Developed as part of the Taller Bogotá course at Universidad Nacional de Colombia, this project proposes an integrated information system combining physical infrastructure (interactive totems and digital displays) with a mobile application to transform the public transportation experience in Bogota.
The Challenge
Users of Bogota’s Integrated Public Transport System (SITP) face multiple pain points:
- ⏱️ Uncertainty about wait times: “How long will I be waiting at this stop?”
- 🚌 Route confusion: “Which bus should I take?”
- 🗺️ Navigation complexity: “Is there a faster way to get there?”
- 📍 Real-time tracking gaps: “Where is my bus right now?”
- 🔄 Transfer inefficiency: “How many transfers will this route require?”
These issues stem from information asymmetry between the system and its users, leading to frustration, wasted time, and reduced trust in public transportation.
Design Challenge Statement
“How can we guarantee timely information to users about their trip planning to improve their travel experience in Bogota’s transport system?”
Key Determinants
The project identified three critical factors affecting user experience:
- ⏱️ TIME - The primary variable affecting user satisfaction
- Wait time at stops (average: 10-15 minutes)
- Transfer time between routes
- Total journey duration uncertainty
- Lack of real-time updates
- 👥 USER BEHAVIOR - Understanding traveler needs
- Route unfamiliarity
- Peak hour congestion concerns
- Multiple transfer anxiety
- Accessibility requirements
- 🏗️ INFRASTRUCTURE - System constraints
- Limited digital displays at stops
- Inconsistent information signage
- No real-time tracking capabilities
- Poor integration between routes
Proposed Solution: Three-Layer Information System
The solution consists of three interconnected layers providing information at different touchpoints:
1. 📱 FRONTEND - User Interfaces
Three ways to access real-time information:
A) Mobile Application (Android)
- Route Planning: Origin-destination search with multiple route options
- Real-time Tracking: Live bus location and ETA
- Smart Filters: Sort by shortest time, fewest transfers, or walking distance
- Stop Information: Detailed schedules and route maps
- Personalization: Save favorite routes and destinations
Key Features:
• "Where is my bus?" - Real-time GPS tracking
• "How to get to...?" - Multi-modal route planning
• "Where does my bus stop?" - Stop location finder
• Smart routing algorithm considers traffic, time of day, transfers
B) Interactive Totem
Physical digital kiosk installed at major transit hubs:
Technical Specifications:
- Height: 4.49 meters
- Screen Size: 0.48m × 0.66m LED display
- Material: Stainless steel structure (4.7mm thickness)
- Protection: SGG Stadip transparent glass with solar absorption film
- Finish: Yellow epoxy semi-washable paint
- Branding: Integrated SITP icon and identity
Functionality:
- Touch-screen interface with route planning
- Real-time bus arrival information
- Interactive map navigation
- Accessible design with Braille module integration
C) Digital Bus Stop Displays
Enhanced M10 standard bus stops with digital screens showing:
- Next bus arrivals with countdown timers
- Route information and direction
- Service alerts and updates
- Transfer connections
2. 📊 BLOCKCHAIN DATA LAYER
Social Mobility Network:
- Crowdsourced real-time data collection from users
- GPS tracking of bus locations
- Traffic condition reporting
- Wait time calculation
- Route optimization algorithms
Data Collection Strategy:
- Initial deployment requires 5 active users per route for 2 months
- Builds comprehensive database of:
- Average wait times per stop
- Traffic patterns by time of day
- Actual vs. scheduled arrival times
- Transfer connection reliability
3. 🤖 BIG DATA & AI
Information Transformation:
- Real-time data processing and analysis
- Predictive arrival time algorithms
- Route optimization based on current conditions
- Pattern recognition for service improvements
- Anomaly detection (delays, detours, capacity issues)
Algorithm Considerations:
- Bus wait time at stops
- Current traffic conditions
- Time of day patterns
- Required number of transfers
- Walking distance to/from stops
- Historical reliability data
User Experience Flow
Mobile App Navigation Path
1. Home Screen
┌─────────────────┐
│  Where to go?   │
│  [Search Bar]   │
├─────────────────┤
│ Quick Access:   │
│ • My Stop       │
│ • Nearby Buses  │
│ • Saved Routes  │
└─────────────────┘
2. Route Planning
Origin → Destination Selection
        ↓
   Multiple Options
   (Sorted by time)
        ↓
   Detailed Route View
   (Stops, Transfers, ETA)
        ↓
   Live Navigation
   (Real-time updates)
3. Filter Options
- ⚡ Fastest route
- 🔄 Fewest transfers
- 🚶 Shortest walking distance
- ⏰ Departure time preference
4. Route Information Display
┌──────────────────────┐
│ Bus: C11, 91, SE14   │
├──────────────────────┤
│ Next Arrival: 5 min  │
│ Travel Time: 32 min  │
│ Transfers: 1         │
│ Walking: 400m        │
├──────────────────────┤
│ [Select Route] →     │
└──────────────────────┘
Design System
Information Architecture
Permanent Information:
- Bus stop name and code
- Route numbers served
- Direction indicators
- SITP institutional branding
- Accessibility features (Braille module)
Real-time Information:
- Current time and date
- Next bus arrivals (countdown)
- Service alerts
- Route detours or changes
User-requested Information:
- Route planning results
- Transfer instructions
- Walking directions
- Alternative route options
Visual Language
Color Palette:
- Primary Yellow: SITP brand identity, high visibility
- Navigation Blue: Interactive elements, selected routes
- Alert Red: Delays, important warnings
- Neutral Gray: Background, secondary information
Typography:
- Clear sans-serif fonts for readability
- High contrast for outdoor visibility
- Large text sizes for accessibility
- Hierarchical information display
Iconography:
- Universal transport symbols
- Consistent across all platforms
- Simple, recognizable designs
- Color-coded by information type
Physical Totem Design
Structure Specifications
Dimensions:
- Total Height: 4.49m
- Base Width: 0.90m
- Screen Height: 2.02m (centered at eye level)
- Depth: 0.53m
Materials:
- Frame: Stainless steel sheets (4.7mm thickness)
- Screen Protection: SGG Stadip glass with UV absorption
- Finish: Yellow epoxy semi-washable paint
- Mounting: Anchored foundation with drainage
Construction Details:
- Modular design for maintenance access
- Weather-resistant sealed electronics compartment
- Vandal-resistant materials
- Energy-efficient LED backlighting
- Solar panel integration option
Components:
┌─────────────────┐  ← SITP Icon Header
│   ╔═══════╗     │
│   ║ TOTEM ║     │  ← Brand Identity
│   ╚═══════╝     │
├─────────────────┤
│                 │
│  ▓▓▓▓▓▓▓▓▓▓▓▓  │  ← LED Display
│  ▓ Interactive ▓ │     (0.48m × 0.66m)
│  ▓   Screen   ▓ │
│  ▓▓▓▓▓▓▓▓▓▓▓▓  │
│                 │
├─────────────────┤
│  Route Panel    │  ← Static Info
│  Stop Info      │
└─────────────────┘
M10 Bus Stop Enhancement
Current SITP M10 Module
Existing Features:
- Polycarbonate curved translucent cover
- Steel structure with anti-corrosion coating
- Metal tubes and plates for support
- Matte stainless steel finish
Information Elements:
- Cenefa (Header band): Stop name and direction
- Flag: Route numbers and permanent information
- Braille Module: Accessibility features
- Institutional Information: SITP branding and contacts
Proposed Enhancement
Digital Integration:
- Small LED display mounted on flag post
- Solar-powered electronics
- Wireless data connection
- Weather-sealed enclosure
Information Display:
- Real-time countdown to next bus
- Route confirmation
- Service alerts
- QR code for app download
Technology Stack
Mobile Application
Platform: Android (Native) Development: Java/Kotlin API Integration:
- GPS location services
- Google Maps API
- SITP route database
- Real-time tracking backend
Versions Developed:
- TBogV1.apk (4.3 MB) - Initial prototype
- TBogV2.apk (4.9 MB) - UI improvements
- TBogV3.apk (5.2 MB) - Added route filters
- TBogV4.apk (5.5 MB) - Final version with all features
- TBog(Experimental).apk - Testing build
- TBogParadero.apk - Stop-focused variant
Data Infrastructure
Backend Services:
- Node.js/Express server
- MongoDB database
- Redis cache for real-time data
- RESTful API endpoints
Data Sources:
- GPS trackers on buses
- User-submitted location data
- SITP official schedules
- Traffic API integration (Waze, Google)
Blockchain Implementation:
- Distributed data collection network
- User contribution validation
- Data integrity verification
- Anonymous usage analytics
Hardware
Totem Components:
- Raspberry Pi 4 or equivalent SBC
- 0.48m × 0.66m LED touchscreen
- 4G/5G cellular modem
- GPS module
- Weatherproof enclosure
- Backup battery (12V, 7Ah)
Stop Display Components:
- Arduino-based controller
- Small LED matrix display
- Solar panel (20W)
- Li-ion battery pack
- ESP32 for WiFi connectivity
Implementation Strategy
Phase 1: Pilot Program (Months 1-2)
Objectives:
- Deploy 5 interactive totems at high-traffic stations
- Launch mobile app beta with 1,000 test users
- Collect baseline data on 20 priority routes
Locations:
- Portal Tunal
- Portal Norte
- Portal 80
- Portal Americas
- Portal Suba
Metrics:
- User engagement rate
- Data accuracy (actual vs. predicted arrivals)
- App downloads and retention
- Totem interaction frequency
Phase 2: Data Collection (Months 2-4)
Goal: Build comprehensive database
Requirements:
- Minimum 5 active users per route
- 2 months of continuous data collection
- Coverage of all SITP routes
- Peak and off-peak hour sampling
Validation:
- Cross-reference with official SITP data
- Outlier detection and removal
- Pattern recognition for reliability
- Algorithm training and refinement
Phase 3: Expansion (Months 4-12)
Rollout Plan:
- Install totems at 50 major stations
- Enhance 200 M10 stops with digital displays
- Scale mobile app to 100,000+ users
- Full SITP route integration
Marketing:
- In-station advertising
- Social media campaigns
- Partnership with SITP official channels
- Influencer and community outreach
Phase 4: Optimization (Year 2+)
Continuous Improvement:
- AI-driven route recommendations
- Predictive analytics for service planning
- Integration with other transport modes (bike, taxi)
- Accessibility features enhancement
- Multilingual support
User Research Insights
Key Findings from Field Studies
User Pain Points (Ranked by Frequency):
- “I don’t know when the bus will arrive” - 87% of respondents
- “I’m not sure if this is the right bus” - 72%
- “The bus is always full” - 68%
- “I waste more time waiting than traveling” - 64%
- “Routes keep changing without notice” - 61%
Wait Time Analysis:
Average Wait Time per Stop Type:
• Portal Stations: 8-12 minutes
• Trunk Line Stops: 10-15 minutes
• Feeder Routes: 15-25 minutes
• Peak Hours: +40% increase
User Demographics:
- Primary Users: Working professionals (25-45 years)
- Daily Commuters: 2-4 trips per day
- Route Complexity: Average 1.5 transfers per journey
- Smartphone Ownership: 78% of regular SITP users
Usability Testing Results
Mobile App Prototype Testing (n=50):
- ✅ 92% found route planning intuitive
- ✅ 88% preferred filter options (time, transfers, distance)
- ✅ 85% said real-time tracking reduced anxiety
- ⚠️ 15% requested offline mode for route planning
- ⚠️ 23% wanted integration with payment system
Totem Interaction Testing (n=30):
- ✅ 94% successfully found their route within 30 seconds
- ✅ 87% preferred visual map over text instructions
- ⚠️ 20% had difficulty with touchscreen sensitivity
- ⚠️ 12% wanted larger text for accessibility
Design Principles
1. Empathy-Driven Language
The system uses conversational, user-centered language:
- ❌ “Próximo bus” → ✅ “Tu bus”
- ❌ “Estación de destino” → ✅ “¿A dónde vas?”
- ❌ “Seleccione ruta” → ✅ “Elige tu ruta”
2. Information Hierarchy
Priority 1 (Largest, Most Prominent):
- Next bus arrival time
- Route number
- Current location
Priority 2 (Secondary Emphasis):
- Total journey time
- Number of transfers
- Alternative routes
Priority 3 (Contextual Information):
- Detailed stop list
- Service alerts
- Accessibility options
3. Accessibility First
Visual:
- High contrast color schemes
- Large, legible typography
- Icons with text labels
- Color-blind friendly palette
Physical:
- Braille modules on totems
- Audio announcements option
- Touch-friendly button sizes (minimum 44×44px)
- Screen reader compatibility
Cognitive:
- Simple, consistent navigation
- Clear visual feedback
- Progressive disclosure of information
- Undo/back options always available
Business Model & Sustainability
Revenue Streams
- Advertising on Totems
- Digital display advertising between information screens
- Location-based targeted ads
- Revenue share with SITP
- Data Analytics Services
- Anonymous aggregate data for urban planning
- Route optimization insights for TransMilenio
- Traffic pattern reports for government agencies
- Partnership with Payment Systems
- Integration with TuLlave card recharge
- In-app payment options
- Transaction fee revenue
Cost Structure
Initial Investment:
- Totem Manufacturing: $15,000 USD per unit
- M10 Display Retrofit: $2,000 USD per stop
- App Development: $80,000 USD (one-time)
- Backend Infrastructure: $120,000 USD
Ongoing Costs:
- Maintenance: $500/month per totem
- Data hosting: $3,000/month
- Cellular connectivity: $50/month per device
- Team salaries: $25,000/month
Break-even Analysis:
- 50 totems deployed
- 100,000 monthly active app users
- Estimated break-even: 18-24 months
Impact & Outcomes
Expected Benefits
For Users:
- ⏱️ 30% reduction in perceived wait time
- 📉 25% decrease in missed connections
- 🎯 40% improvement in route planning confidence
- 😊 35% increase in overall satisfaction with SITP
For SITP System:
- 📊 Real-time operational data for better scheduling
- 🚌 More efficient bus deployment
- 💰 Potential ridership increase of 15-20%
- 🏆 Improved public perception of public transport
For City of Bogotá:
- 🌱 Reduced private vehicle usage
- 🚦 Better traffic flow management
- 📈 Data-driven urban mobility planning
- 💡 Smart city infrastructure advancement
Success Metrics
Short-term (3-6 months):
- App downloads: 50,000+
- Daily active users: 10,000+
- Average session duration: 3-5 minutes
- User retention rate: >60%
Medium-term (6-12 months):
- Totem interactions: 500+ per day per device
- Route planning accuracy: >85%
- Predicted arrival time accuracy: ±3 minutes
- User satisfaction score: >4.0/5.0
Long-term (1-2 years):
- SITP ridership increase: 15-20%
- Reduction in complaints: 40%
- System coverage: 80% of SITP routes
- Integration with other transport modes
Challenges & Solutions
Challenge 1: Data Accuracy
Problem: GPS data can be unreliable in dense urban areas with tall buildings.
Solution:
- Multi-source data fusion (GPS + user reports + schedule)
- Machine learning algorithms to correct anomalies
- Confidence indicators on arrival predictions
- Fallback to schedule-based estimates
Challenge 2: User Adoption
Problem: Digital divide - not all users have smartphones or tech literacy.
Solution:
- Physical totems at key stations
- Enhanced M10 stops with digital displays
- Simple, intuitive interface design
- In-person demonstrations and training
- Multilingual support
Challenge 3: Infrastructure Maintenance
Problem: Vandalism and weather damage to outdoor equipment.
Solution:
- Vandal-resistant materials (stainless steel, tempered glass)
- Modular design for easy component replacement
- Remote diagnostics and monitoring
- Regular maintenance schedule
- Community engagement for ownership
Challenge 4: Real-time Data Collection
Problem: Initial lack of GPS tracking on all buses.
Solution:
- Phased rollout starting with trunk lines
- Crowdsourced data from app users
- Hybrid approach using schedule data initially
- Gradual improvement as tracking coverage increases
Challenge 5: Privacy Concerns
Problem: Users may be hesitant to share location data.
Solution:
- Anonymous data collection
- Opt-in location sharing with clear benefits
- Transparent privacy policy
- No personally identifiable information stored
- Compliance with data protection regulations
Future Enhancements
Short-term Roadmap (Year 1)
- Payment Integration: In-app TuLlave card recharge
- Offline Mode: Downloaded route maps for no-connectivity areas
- Push Notifications: Bus arrival alerts, service disruptions
- Social Features: Share routes with friends, commute communities
- Accessibility: Voice control, high-contrast mode
Medium-term Vision (Years 2-3)
- Multi-modal Integration:
- Bicycle sharing (EnCicla)
- Taxi services (yellow cabs)
- Ride-sharing options
- Walking directions with safety ratings
- Predictive Journey Planning:
- “Leave now to arrive by 3pm”
- Traffic-aware recommendations
- Weather-adjusted travel times
- Augmented Reality:
- AR wayfinding at complex stations
- Point phone to see bus locations
- Overlay route information on camera view
Long-term Possibilities (Years 3-5)
- Autonomous Vehicle Integration: Ready for driverless bus deployment
- City-wide Mobility Platform: Single app for all transport in Bogotá
- Carbon Footprint Tracking: Gamification of sustainable transport choices
- Demand-responsive Routing: Dynamic routes based on passenger requests
- Smart City Integration: Connect with traffic lights, parking, urban events
Team & Collaboration
Project Team
Pilar Monroy
- Role: UX Research & User Testing
- Focus: Ethnographic studies, user interviews, persona development
Jan Caroline Montaño Guerra
- Role: UI Design & Visual Identity
- Focus: Mobile app interfaces, totem design, design system
Alejandro Ojeda
- Role: Technical Architecture & IoT
- Focus: Hardware specifications, data infrastructure, blockchain implementation
David Sarmiento
- Role: Product Strategy & Business Model
- Focus: Stakeholder engagement, feasibility analysis, rollout planning
Course Context
Institution: Universidad Nacional de Colombia Course: Taller Bogotá Program: Design / Urban Studies Year: 2019 Duration: 1 semester (6 months)
Stakeholder Engagement
Consulted Organizations:
- TransMilenio S.A. (SITP operator)
- Bogotá Mobility Secretariat
- Urban planning department
- Accessibility advocacy groups
- Transit user associations
Documentation & Deliverables
Project Artifacts
- Entrega Final (Final Delivery Poster)
- Visual summary of complete system
- User flow diagrams
- Totem technical drawings
- App interface mockups
- Memoria (Project Memory Document - 14 pages)
- Problem definition and research
- Design process documentation
- Technical specifications
- Implementation roadmap
- Future projections
- Mobile Application Prototypes
- TBogV1-V4: Progressive feature development
- Experimental builds for testing
- Stop-focused variant (TBogParadero)
- Visual Assets
- App icon and branding
- UI screenshots and wireframes
- Frontend designs for all screens
- Demo videos and GIFs
Lessons Learned
What Worked Well
✅ User-centered approach - Constant validation with real SITP users ✅ Integrated solution - Physical + digital touchpoints for all user types ✅ Realistic constraints - Designed within SITP’s existing infrastructure ✅ Scalable architecture - Blockchain data layer allows gradual rollout ✅ Accessible design - Considered users of all abilities and tech literacy levels
Areas for Improvement
⚠️ Technical feasibility - Some blockchain implementations were ambitious ⚠️ Cost estimates - Initial projections may underestimate maintenance ⚠️ Stakeholder buy-in - More engagement with TransMilenio needed ⚠️ Pilot validation - Prototype testing was limited to mockups ⚠️ Cultural adoption - Behavior change strategies need more development
Key Takeaways
- Information is power: Users just need to know when their bus will arrive
- Trust is earned: Accuracy matters more than fancy features
- Multiple touchpoints: Not everyone has a smartphone
- Start small: Pilot programs validate assumptions before scale
- Design for maintainability: Beautiful designs must survive real-world conditions
Conclusion
The Taller Bogotá SITP Information System demonstrates how thoughtful UX design combined with modern technology can significantly improve public transportation experiences. By addressing the fundamental information gap between the system and its users, this project proposes a practical, scalable solution that could increase ridership, reduce frustration, and contribute to more sustainable urban mobility in Bogotá.
The three-layer approach—frontend interfaces (app, totems, displays), blockchain data collection, and AI-powered optimization—creates a robust ecosystem that benefits users, operators, and city planners alike. While ambitious in scope, the phased implementation strategy makes the vision achievable within realistic constraints.
The ultimate goal: Transform SITP from a source of daily frustration into a reliable, user-friendly transportation network that Bogotá residents actually want to use.
Technical Specifications Summary
| Component | Specification |
|---|---|
| Mobile App | Android 7.0+, 5.5MB, GPS required |
| Totem Height | 4.49 meters |
| Display Size | 0.48m × 0.66m LED touchscreen |
| Totem Material | Stainless steel (4.7mm), epoxy paint |
| Power | AC with 12V backup battery |
| Connectivity | 4G/5G cellular, WiFi backup |
| Data Update | Real-time (5-second refresh) |
| M10 Display | LED matrix, solar-powered |
| Backend | Node.js, MongoDB, Redis cache |
| API | RESTful, JSON responses |
References & Resources
-
SITP Official Documentation - TransMilenio S.A. route and infrastructure standards
-
Urban Mobility Best Practices - Case studies from London (TfL), Singapore (LTA), Barcelona (TMB)
-
Accessibility Guidelines - WCAG 2.1 standards for digital interfaces
-
Material Specifications - Stainless steel AISI 304, SGG Stadip glass technical sheets
-
Android Development - Google Material Design guidelines for mobile apps
-
IoT Hardware - Raspberry Pi Foundation, Arduino documentation
-
User Research - Field studies conducted at 15 SITP stations, July 2019
Keywords
UX Design UI Design Public Transport Urban Mobility Mobile App Android IoT Smart City Bogotá SITP Blockchain Real-time Tracking Route Planning Digital Signage Interactive Totem User Experience Transportation Design Information Architecture Accessibility Navigation
Project Status
Status: Conceptual design completed (July 2019) Implementation: Prototype phase - requires stakeholder partnership Contact: Available for collaboration with TransMilenio S.A. or Bogotá Mobility Secretariat
Repository: Local project files available License: Academic project - Universidad Nacional de Colombia
Components & Materials
| Component | Qty |
|---|---|
| Interactive Digital Totem | x1 |
| LED Display Panel | x1 |
| Mobile Application (Android APK) | x1 |
| M10 Bus Stop Module | x1 |
Mobile app demo - Route planning interface
Mobile app demo - Real-time bus tracking

Physical totem prototype at bus stop
SITP integration app icon design

App navigation menu interface
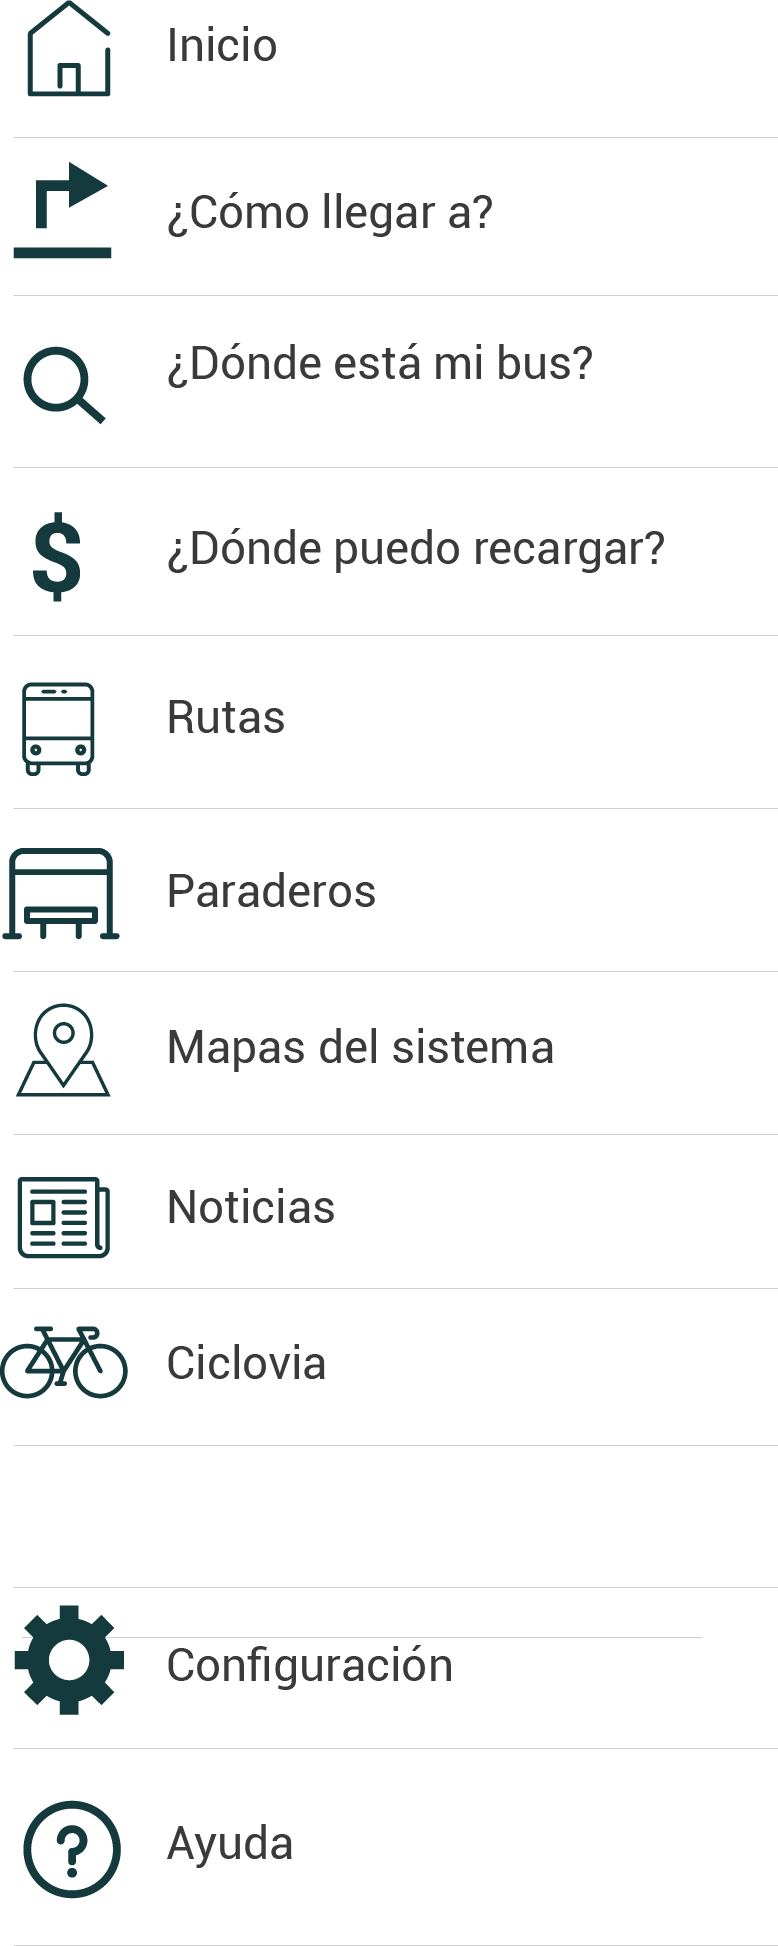
Alternative menu design with route options
App settings and configuration screen